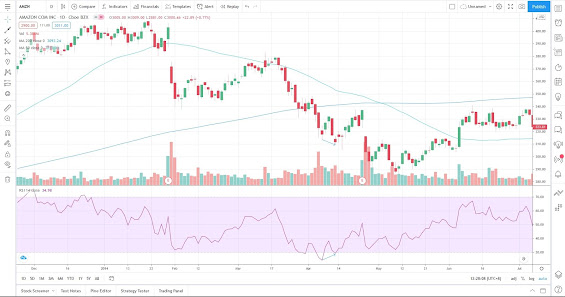
Tips:
- Nov 15 2012, stock price hit 200 ma, possible bounce back.
- RSI and price have divergence.
- Oct 25 2012 RSI below 30, hit a oversold. This can be treated a very good basepoint. Any new low point of RSI in the future can be compared with this basepoint to see if they have divergence with price.
- Nov 15 2012, a medium green bar with the volume a little up.
- The next three days, price keeps going up and the volume not go up but go down a little.
- This a long hint by this candlestick volume combination.
- Why? The market mind set can be translated like this. The buyers enter, put a little more money to buy, and the next three days, buyers keep buying, but not too loud. At the same time, no sellers sell a lot. The stock can use very little volume to reach a lot higher. Means buyers are at control.
- The similar situation of the stock also is on Dec 31 2012
- Apr 11 2014, this stock hit another RSI regular divergence, after a RSI below 30. The previous time is 2012, so it doesnt apear very often.
- Then the price goes up for a range.


No comments:
Post a Comment