Candlestick patterns -- Doji
Doji by the definition, it doesnt have body, but in the real trading, very rare to find exactly the open price equals the close price situation.
So as long as the candlestick has relatively long wicks, can treat it as Doji.
And the doji sometimes is very alike star. We shouldnt be constrained by the definition, but should read the market context and make trading instruction.
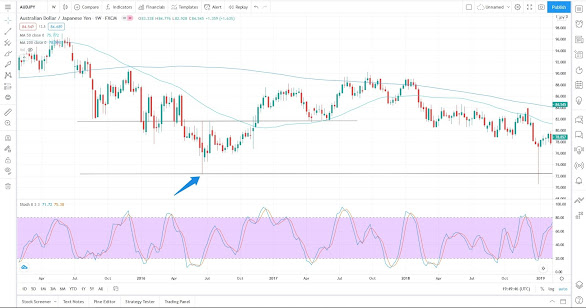
- Arrow place shows a dragonfly doji.
- It also can be treated as a hammer.
- No matter what traders call it. it shows a long hint.
- Why? The long lower wick means buyers take over the sellers.
- If the price move in a range, dragonfly doji can be treated as long hint if it show at the support area of the range.
Candlestick patterns -- Dragonfly doji
- Arrow place shows a dragonfly doji.
- It also can be interpreted as hammer.
- If the price is on uptrend and dragonfly doji hits some ma, long it.
- In this chart the doji also hit 50 ma, more chance to bounce back.
Candlestick patterns -- Gravestone doji
- Arrow place shows a gravestone doji.
- It also can be interpreted as shooting star.
- No matter what traders call it. it shows a short hint.
- Why? The long upper wick means sellers take over the buyers.
- If the price move in a range, gravestone doji can be treated as short hint if it show at the resistance area of the range.
Candlestick patterns -- Gravestone doji
- Arrow places show gravesone dojis.
- It also can be interpreted as shooting star.
- If the price is on downtrend and gravesone doji hits some ma, short it.
- In this chart the doji also hit 50 ma, more chance to go down.
Candlestick patterns -- Long-legged doji
- Arrow place shows a long-legged doji.
- It means buyers and sellers have indecision, cannot be treated as long or short hint.
- Can treat the highest point as resistance, and lowest point as support. The price will probably move inside this range for a while.
- Can see after price break out on 2016 nov 21, it has two consolidations. And each consolidation immediately bounce back once hit the upper trend line. Means the previous resistance becomes support.
Zoom in:


No comments:
Post a Comment